Using the Value Added Score to challenge the BME attainment gap

Using the Value Added score to influence change

Group of four women and one man sitting around a table and making notes on a flip chart

While the BME attainment gap may be well known within the HE sector, the use of metrics is crucial in helping define the size of the gap and in assessing the success of interventions to address the gap. 

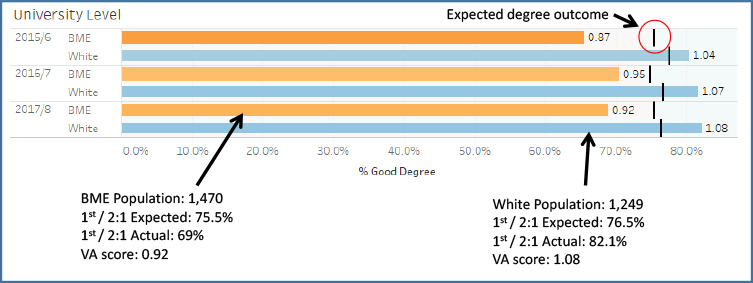
Kingston University has developed a value added metric which has proved to be a powerful way of measuring attainment gaps right down to course level. One of the two principal aims of this project was to determine the transferability of the VA methodology to other institutions.

What are Value Added scores?

Student degree attainment is closely related to a student’s entry qualifications and subject of study. By controlling for both of these factors the Value Added (VA) metric exposes unexplained gaps in attainment

VA scores are calculated by taking the actual degree outcomes for all UK domiciled graduates across the UK for the last five years, broken down by fifty entry qualification bands  and subject of study. This allows us to calculate a probability that a given student will achieve a 1st/2:1 degree. Aggregating these probabilities produces an ‘expected’ percentage for any given cohort of students who should achieve a 1st/2:1 degree. If the cohort achieves this percentage, the VA score is 1.0. For percentage attainment above or below the expectation the VA score is proportionately greater or less than 1.0.

VA scores have been calculated at institution, faculty, school and course level. VA scores can also be used to demonstrate attainment gaps for any other student characteristics for which we have data such as gender, age, disability, socio economic group or commuting students.  These are all presented on easily navigated Tableau dashboards which are accessible to all staff.

Screenshot of value added score dashboard

The Value Added Score: how to use the dashboards


Access the interactive video guide to using the value added data in Tableau and see the type of information that it is possible to generate and demonstrates the potential value having this information could be for your institution.

Using Value Added scores to drive change

Central to Kingston’s approach has been the dissemination of the VA data, created by Matt Hiely-Rayner of Intelligent Metrix.  Presenting the VA scores down to course level through a series of meetings with academic teams has proved a very powerful means of engaging staff in discussion around the attainment gap. Meetings are used to explain the VA data, discuss the research evidence around the attainment gap, describe the support activities available and hear of initiatives and notable practice taking place in departments.

The above Prezi details the steps to be taken to calculate the value added score.

Disseminating the VA approach

One of the principal aims of this Catalyst project was to determine how far it was possible for other HEIs to create value added dashboards and then use these to generate responses to the BME attainment gap. Training was therefore given to all partners both in creating the dashboards and disseminating the findings.


Creating the VA – partner experiences

So how long will it take to create the value added score? How complicated is it? Following a day’s training by the team at Kingston University (and associated materials), all the partners managed to successfully create their own dashboard mirroring the Kingston format. There was considerable variation in the ease with which this was achieved with the majority of partners finding it straightforward (with some difficulties), while others found it quite complex, but all found it achievable. This variation was reflected in the time taken to develop the dashboards, which ranged from 1 day to 30 days (with the majority taking between 5-15 days). One partner utilised the skills of a student to complete the dashboard which proved to be a valuable learning experience for the student involved. Partners reported that when familiarity with the Access programme was an issue, excel was used as a substitute but this was found in both cases to complicate the exercise.

However all were of the view that having created the dashboards they had a valuable tool which would be very easy to update with annual data, requiring no more than a day or half a day.

It was suggested an online forum would have helped those creating the VA to share experiences, challenges and solutions to problems such as how to deal with integrated enhanced masters courses or joint degrees unevenly split between subjects.

The facts:

It took between 1-30 days to create the dashboard, however once created time spent reduces to half a day/a day annually to update

Using excel instead of Access was possible, but extended the time taken to create

Going forward an online forum could help share experiences and solutions to challenges

Student adding a post it note to a board

Rolling out the dashboards more widely – the lessons

All felt that, whatever their experiences of developing the dashboards they were a valuable tool which could be rolled out much more widely. This would be best achieved by:

  1. Ensuring those approaching this were familiar with HESA data, Tableau and Access (though Excel could substitute for Access)
  2. Offering a face to face training day, the Prezi and the KU dashboard, as in this case, were all seen as key
  3. Providing an online forum to share experience and solutions
  4. Two partners felt that a more detailed technical guide was needed but the others had managed perfectly well without this.